 The DUKES 2013 Report
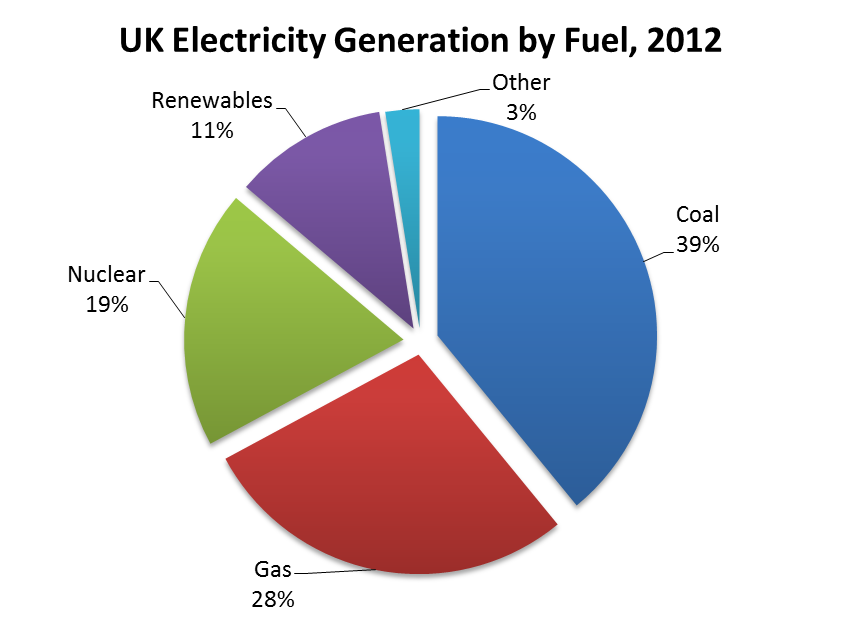
Last month the Department of Energy & Climate Change (DECC) released their Statistical Press Release: The Digest of UK Energy Statistics (aka DUKES) taken from 2012. It has a lot of graphs and numbers but what exactly does it mean?
I’m here to provide a closer look and point out some of the interesting trends.
 Renewable Energy on The Up!
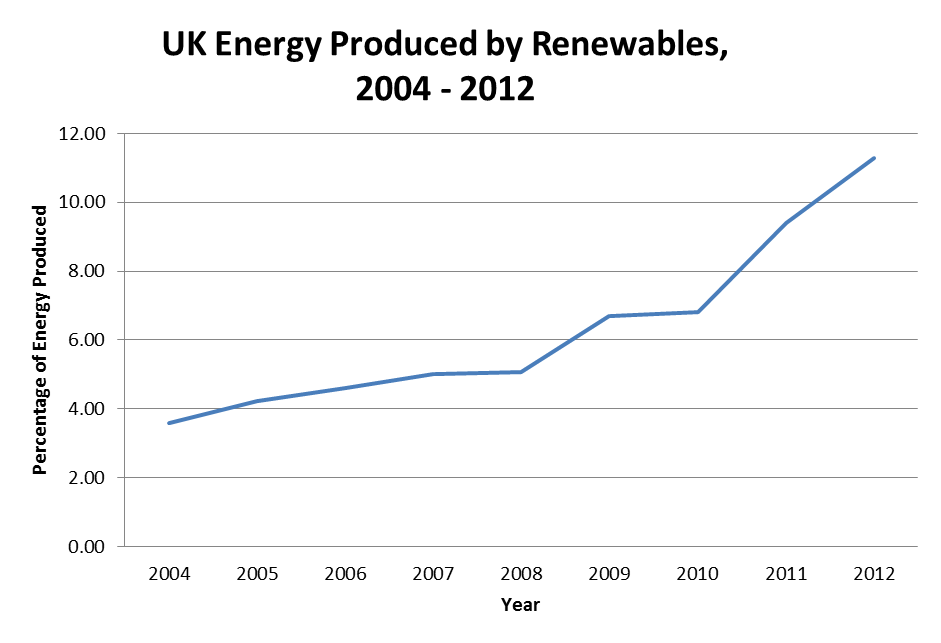
This graph shows the gradual increase of renewable energy produced by the UK from 2004 to 2012. The UK only became interested in renewable energy in the mid-1990’s. The news is good! Each year has shown an increase and each year it has been above the target set by the government.

But It’s Not All Good News …
However, the target set for the government is low compared to other countries. Each time we’ve surpassed that target it has only been by 0.1%, which is hardly breaking any records. Germany, for instance, has just broken its monthly solar power generation record (again). In July 2013 they logged 5.1 terawatt’s hours of electricity. (To put that in to perspective we only got 1114.2 gigawatts from renewable sources!)

Quote From Clean Technica:
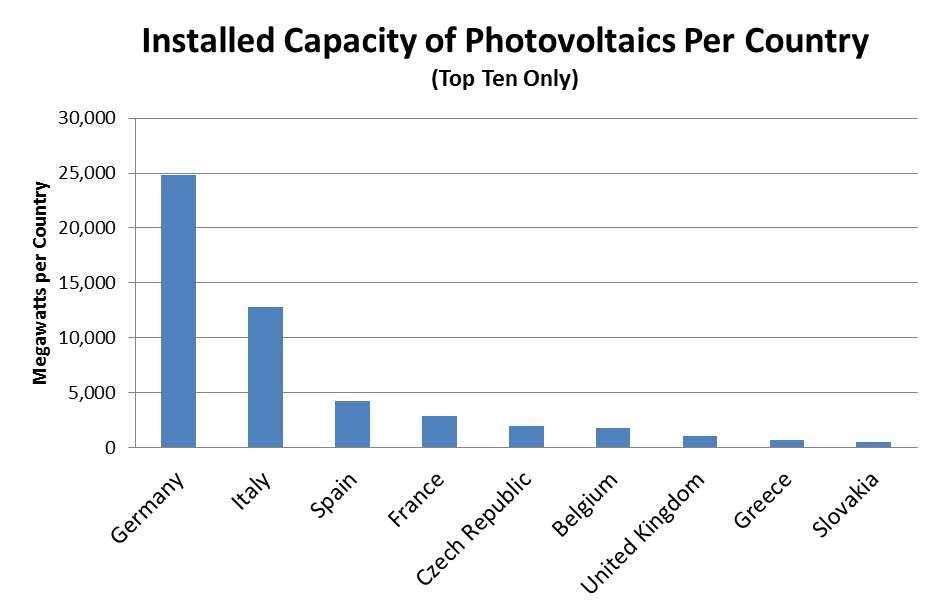
“In terms of total solar power capacity per capita, Germany crushes every other country. At the end of 2012, it had approximately 400 MW of solar power capacity per million people, considerably more than #2 Italy at 267 MW per million people, #3 Belgium at 254 MW per million people, and #4 Czech Republic at 204 MW per million, and #5 Greece at 143 MW per million people. The US came it at #20 with about 25 MW per million people.”
Notice how we don’t even feature on that list? I know we’re a small country but we could be doing more. It’s certainly spiked upwards but it’s hardly the runner-up to winning the medal, let alone the gold seeker!
The Good News
There is good news in this muddle of information. Offshore wind generation (which is the UK’s second largest renewable source currently after biomass) has increased by 46% in 2012 and had a greater load factor than gas. (33.7% from wind compared to 30.4% from gas.)

The Final Word And Going Forwards
Slowly things are changing. It’s not just about turning off the television or light bulb any more. It’s about moving forwards and growing with the changes happening around us. Perhaps the UK government should review their plan and set more aggressive targets for renewable energy so we can try to catch up on the swift progress being made elsewhere in Europe.
Sources:
Germany Breaks Monthly Solar Generation Record, 6.5 Times More than US best, from Clean Technica


One thought on “How Is The UK Re-Charging?”
Comments are closed.